The operational question
The client needed to understand where particles accumulated within the data center. Surface deposition measurements show what reaches equipment-height structures, floors, and overhead spaces over time. The baseline needed to capture local accumulation patterns that a single facility-wide average could obscure.
The study covered two operating buildings, each with four data halls. Collection slides were positioned on floors, on equipment-height goalposts, and in overhead plenums. Using the same three position types in each hall allowed comparisons across all eight halls.
A field collection and laboratory analysis workflow
ARE Labs supplied the collection slides and deployment protocol. The client placed and recovered the slides at the facilities, then returned them to ARE Labs for laboratory analysis.
The client deployed 126 slides for approximately one week. Three slides were excluded from the primary dataset under the report criteria, leaving 123 records for the main mass-deposition analysis. ARE Labs divided the signed mass change by collection area and deployment duration to calculate a daily surface deposition rate in mg/m²/day.
The full preparation set contained 135 slides: 126 deployed slides and nine reference specimens. The reference specimens included three unopened shipping controls, four blanks, and two unused slides. They were prepared and measured on the same schedule but were never exposed at the facility. Their results are therefore reported as mass change and counts per slide rather than deposition rates.
Each slide was weighed twice before shipment and twice after return. ARE Labs averaged the two readings from each stage, then divided the signed mass change by the nominal 3 × 1 inch slide area of 0.00193548 m² and the recorded exposure duration. Negative changes were retained as measured. This calculation put slides with different seven- to eight-day exposure periods on the same daily surface-area basis.
The analysis combined gravimetry with two optical assessments. Whole-slide inspection counted a distinct coarse population nominally larger than 100 µm. Microscopy and image analysis characterized the much smaller retained objects. These populations answer different questions, so their results are reported separately rather than combined into one particle count.
| Measurement | Valid records | Reported result |
|---|---|---|
| Mass deposition rate | 123 slides | Mean 14.7; median 7.5 mg/m²/day |
| Coarse whole-slide count | 121 slides | Mean 2,090; median 1,774 particles/m²/day |
| Microscopy size analysis | 12,501 objects | 76% <2 µm; 93% <3 µm; 98% <5 µm |
Gross results are shown without background subtraction. Whole-slide coarse counts and retained microscopy objects are distinct optical populations.
Deposition mass varied by sampling position
Across the 123-slide primary dataset, the mean mass deposition rate was 14.7 mg/m²/day and the median was 7.5 mg/m²/day. Some slides accumulated substantially more material than the typical slide, raising the overall mean. The gap between mean and median shows why a single average cannot describe every location.
Mean mass deposition rates varied by position within each building. In Building 1, floor, goalpost, and plenum locations averaged 17.6, 18.3, and 5.5 mg/m²/day. Building 2 averaged 12.9, 20.8, and 5.5 mg/m²/day at the same positions. Goalposts had the highest position mean in both buildings; plenums had the lowest, with the same mean in each building.
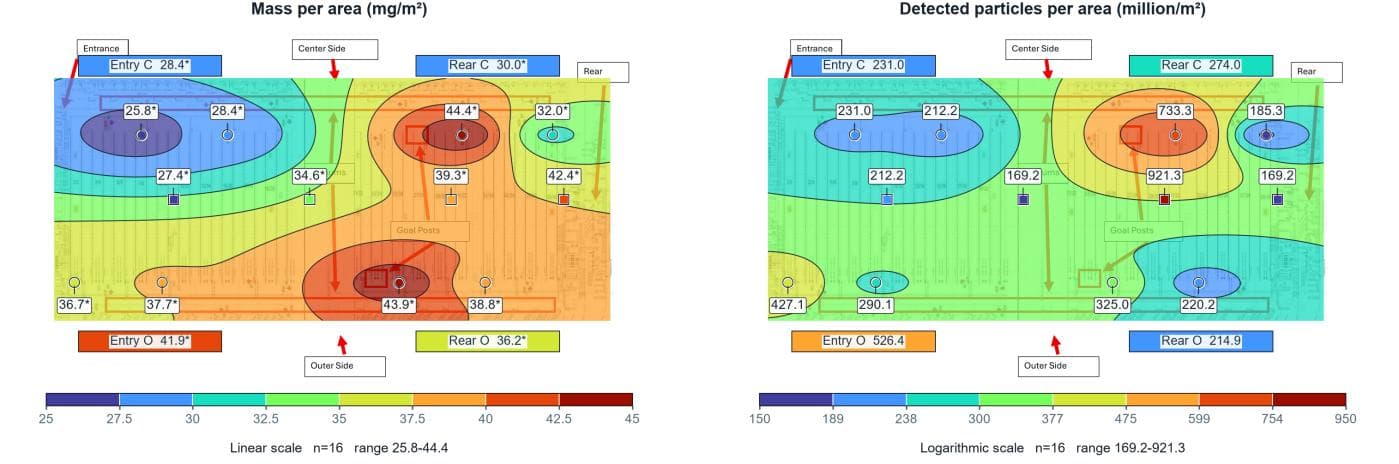
The heat map shows local differences in accumulated mass within one hall that a hall-wide average could conceal. Its mg/m² scale represents the full collection period, while the adjacent comparison chart reports daily rates in mg/m²/day. Marked values identify the collection locations. Colors between them show an interpolated pattern that can help guide follow-up sampling; they do not represent measurements at every point.
View figure data as a table
| position | Building 1 | Building 2 |
|---|---|---|
| Floor | 17.6mg/m²/day | 12.9mg/m²/day |
| Goalpost | 18.3mg/m²/day | 20.8mg/m²/day |
| Plenum | 5.5mg/m²/day | 5.5mg/m²/day |
Source: anonymized ARE Labs data center particle deposition report.
- Values are gross mass deposition rates without background subtraction.
- Building and hall identities are anonymized.
These location differences do not identify the source or transport mechanism of the deposited material. They do show where follow-up investigation or repeated monitoring may be most useful. A facility can use the comparisons to choose future collection locations or decide where to examine maintenance and traffic patterns or collect a longer baseline.
Optical analysis resolved two particle populations
The coarse whole-slide count used 121 valid slides and produced a mean of 2,090 particles/m²/day and a median of 1,774 particles/m²/day. This count represents the report's nominally greater-than-100-µm optical population. Whole-slide inspection and microscopy used different detection windows, so the coarse count should not be added to or directly compared with the microscopy object count.
Microscopy retained 12,501 objects for size analysis. Of those objects, 76% were smaller than 2 µm, 93% smaller than 3 µm, and 98% smaller than 5 µm. The microscopy workflow examined the 1.12-100 µm range under two magnifications. Particles larger than 100 µm were counted by hand on whole slides but were not sized.
Calibrated microscopy and image analysis characterized particles in selected fields. The reported size profile describes the examined fields rather than every particle on a slide.1
View figure data as a table
| threshold | Cumulative share |
|---|---|
| <2 µm | 76% of retained objects |
| <3 µm | 93% of retained objects |
| <5 µm | 98% of retained objects |
Source: anonymized ARE Labs data center particle deposition report.
- Percentages are cumulative within the 12,501 retained microscopy objects.
What the results support
The study established a surface-deposition baseline across two buildings, using the same three sampling heights throughout. The results allow mass accumulation to be compared by location and separately describe coarse whole-slide counts and the size distribution of retained microscopy objects. The report's heat maps show how deposition varied across the sampled halls.
The reported values are gross deposition results without background subtraction. The study did not determine particle source or composition, measure airborne concentration, or assign an ISO cleanliness class. Those questions require additional sampling or analytical work. Optical microscopy describes size and morphology; SEM-EDS can be added when elemental composition is part of the project question.
Summary
The week-long survey gave the client a measured baseline for comparing buildings and sampling heights, with 123 primary slides in the mass-deposition analysis. Separate optical analyses described coarse deposited particles and the size distribution of retained microscopy objects. ARE Labs supplied the collection media and protocol, performed the laboratory analysis, and reported the findings to support monitoring and follow-up decisions.